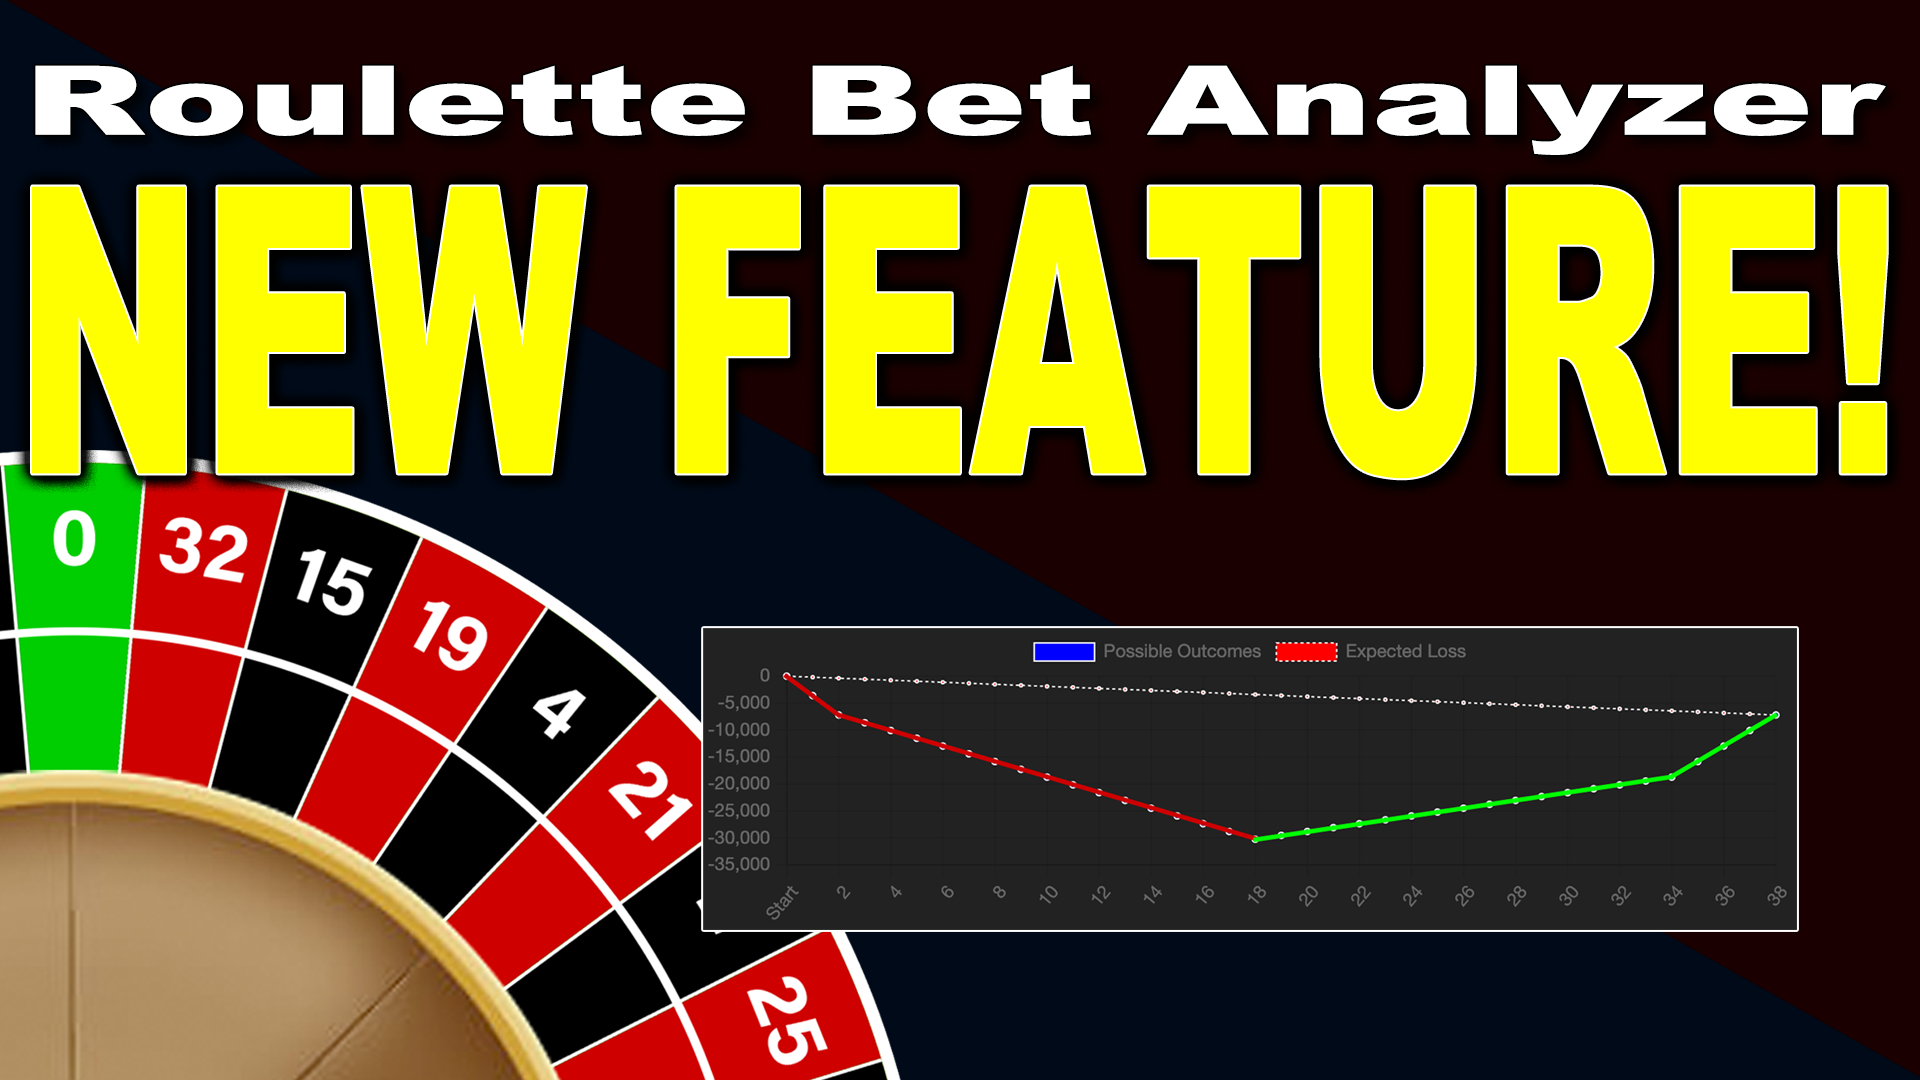
What is an Outcome Graph and how does it show you what to expect from a Roulette betting pattern?
Let's see the Graph!
There's a new feature to the Roulette Bet Analyzer. I've added something that I call Outcome Graphs.
When you enter the details for your Roulette system, a graph will show up at the bottom of the tool.
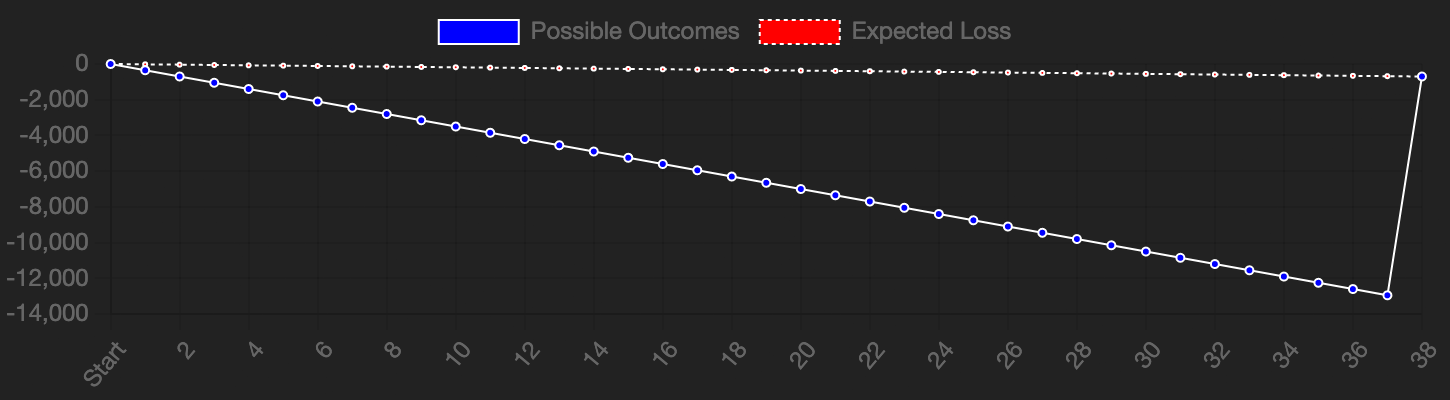
Betting Pattern 1: $350 Straight-up Bet
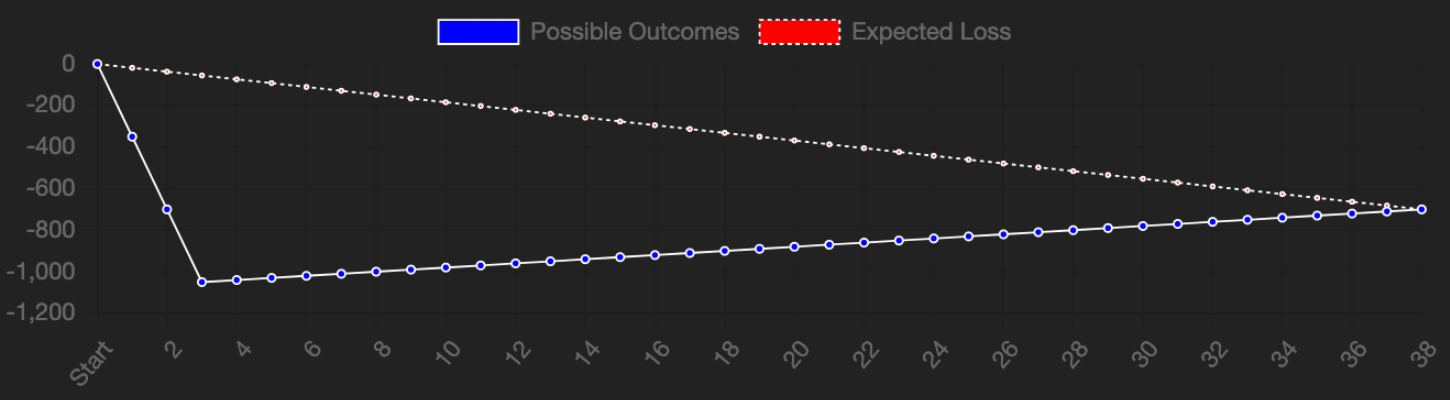
Here's what the Outcome Graph looks like for a single $350 bet on the number
 .
.
 .
.
The graph is a running sum of all the possible outcomes sorted by the worst loss to the highest win.
Here, we can see we will lose 37 times, and win back $350x35 = +$12,250 on the 38th result.
And after 38 trials and $13,300 in wagers, we'd be down -$700 as expected. And this makes sense, because $700/$13,300 is 5.26%, which is the house edge in Double-Zero Roulette.
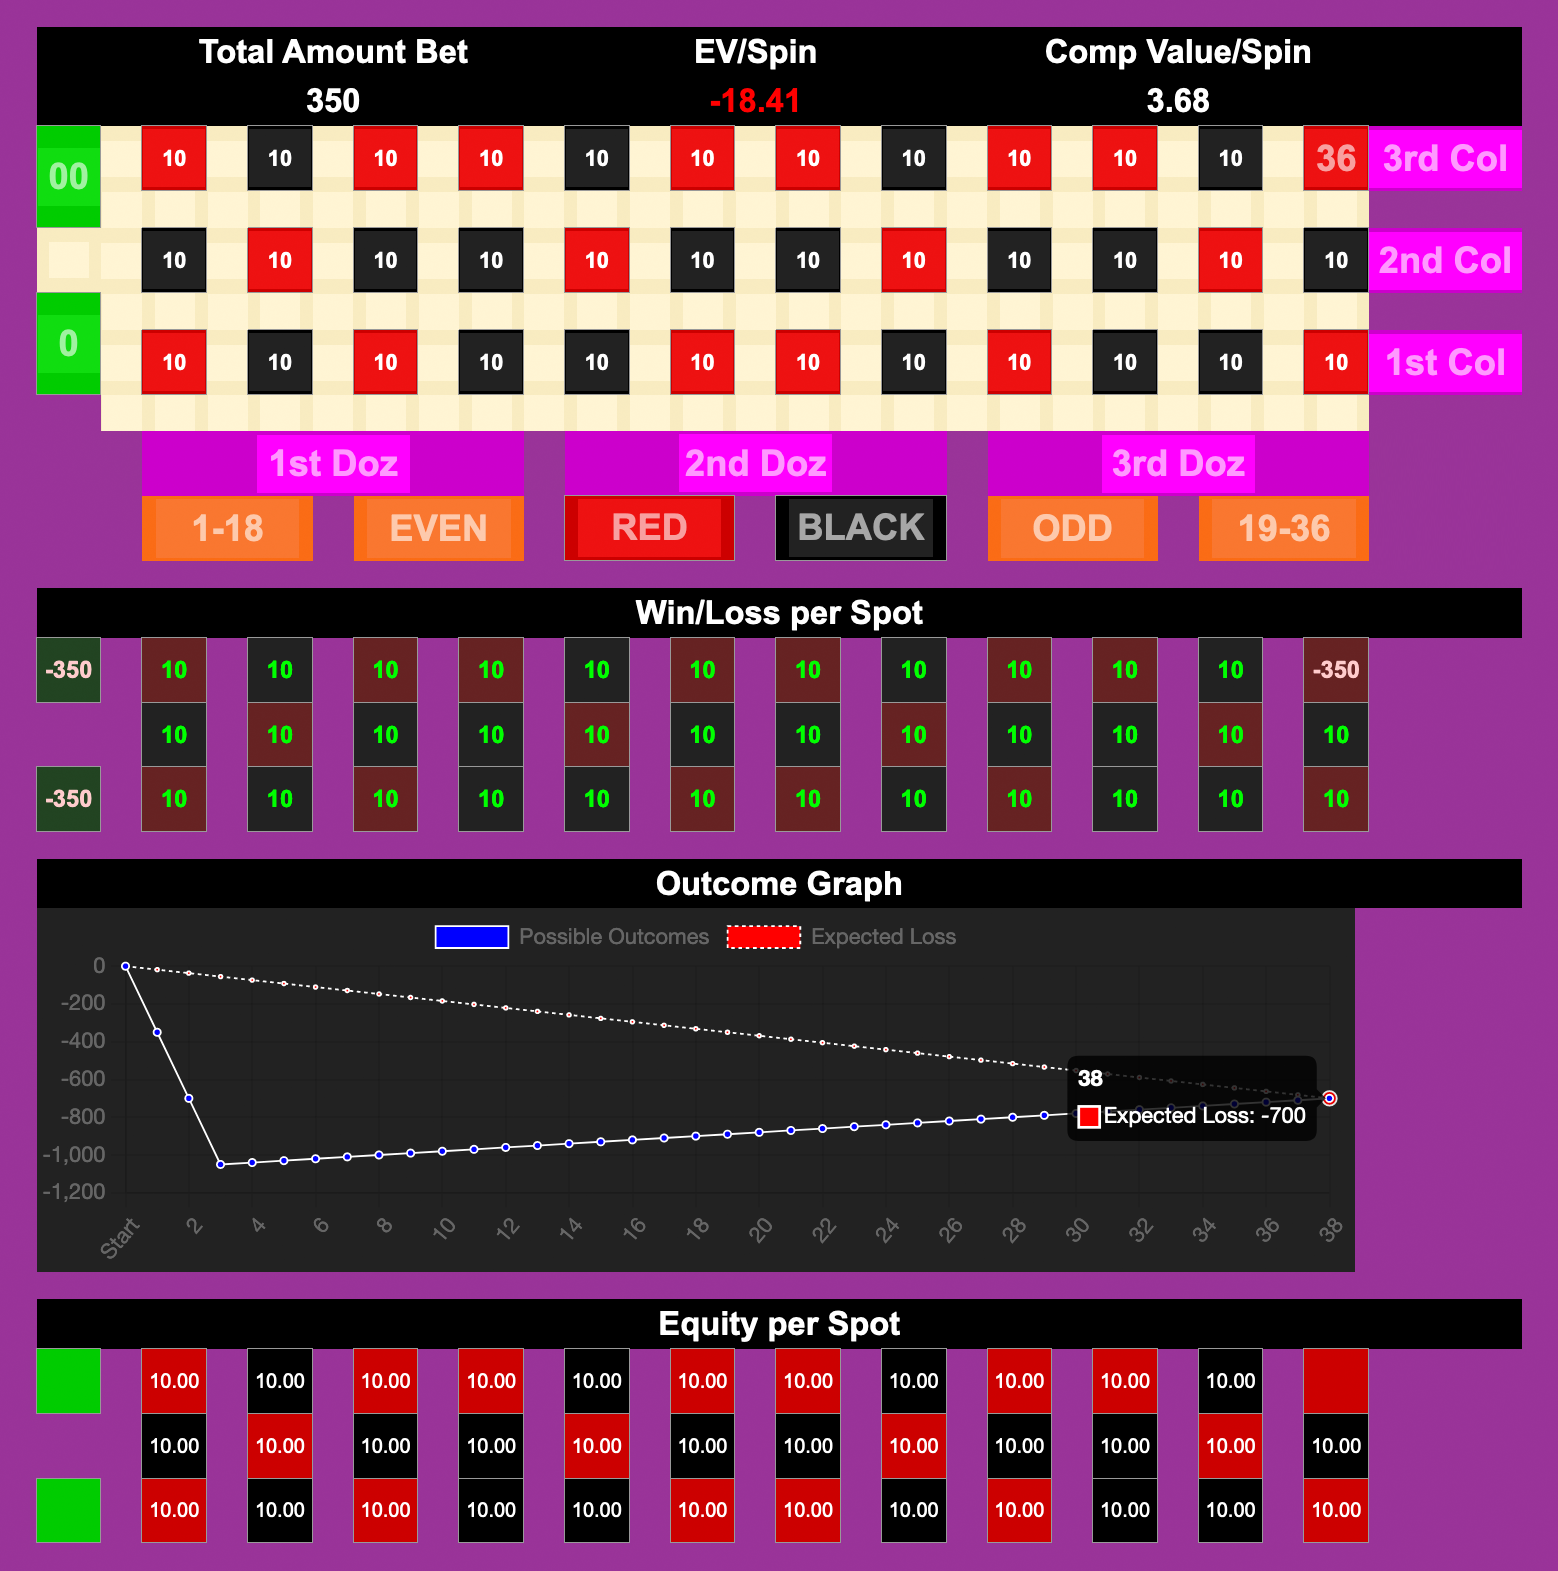
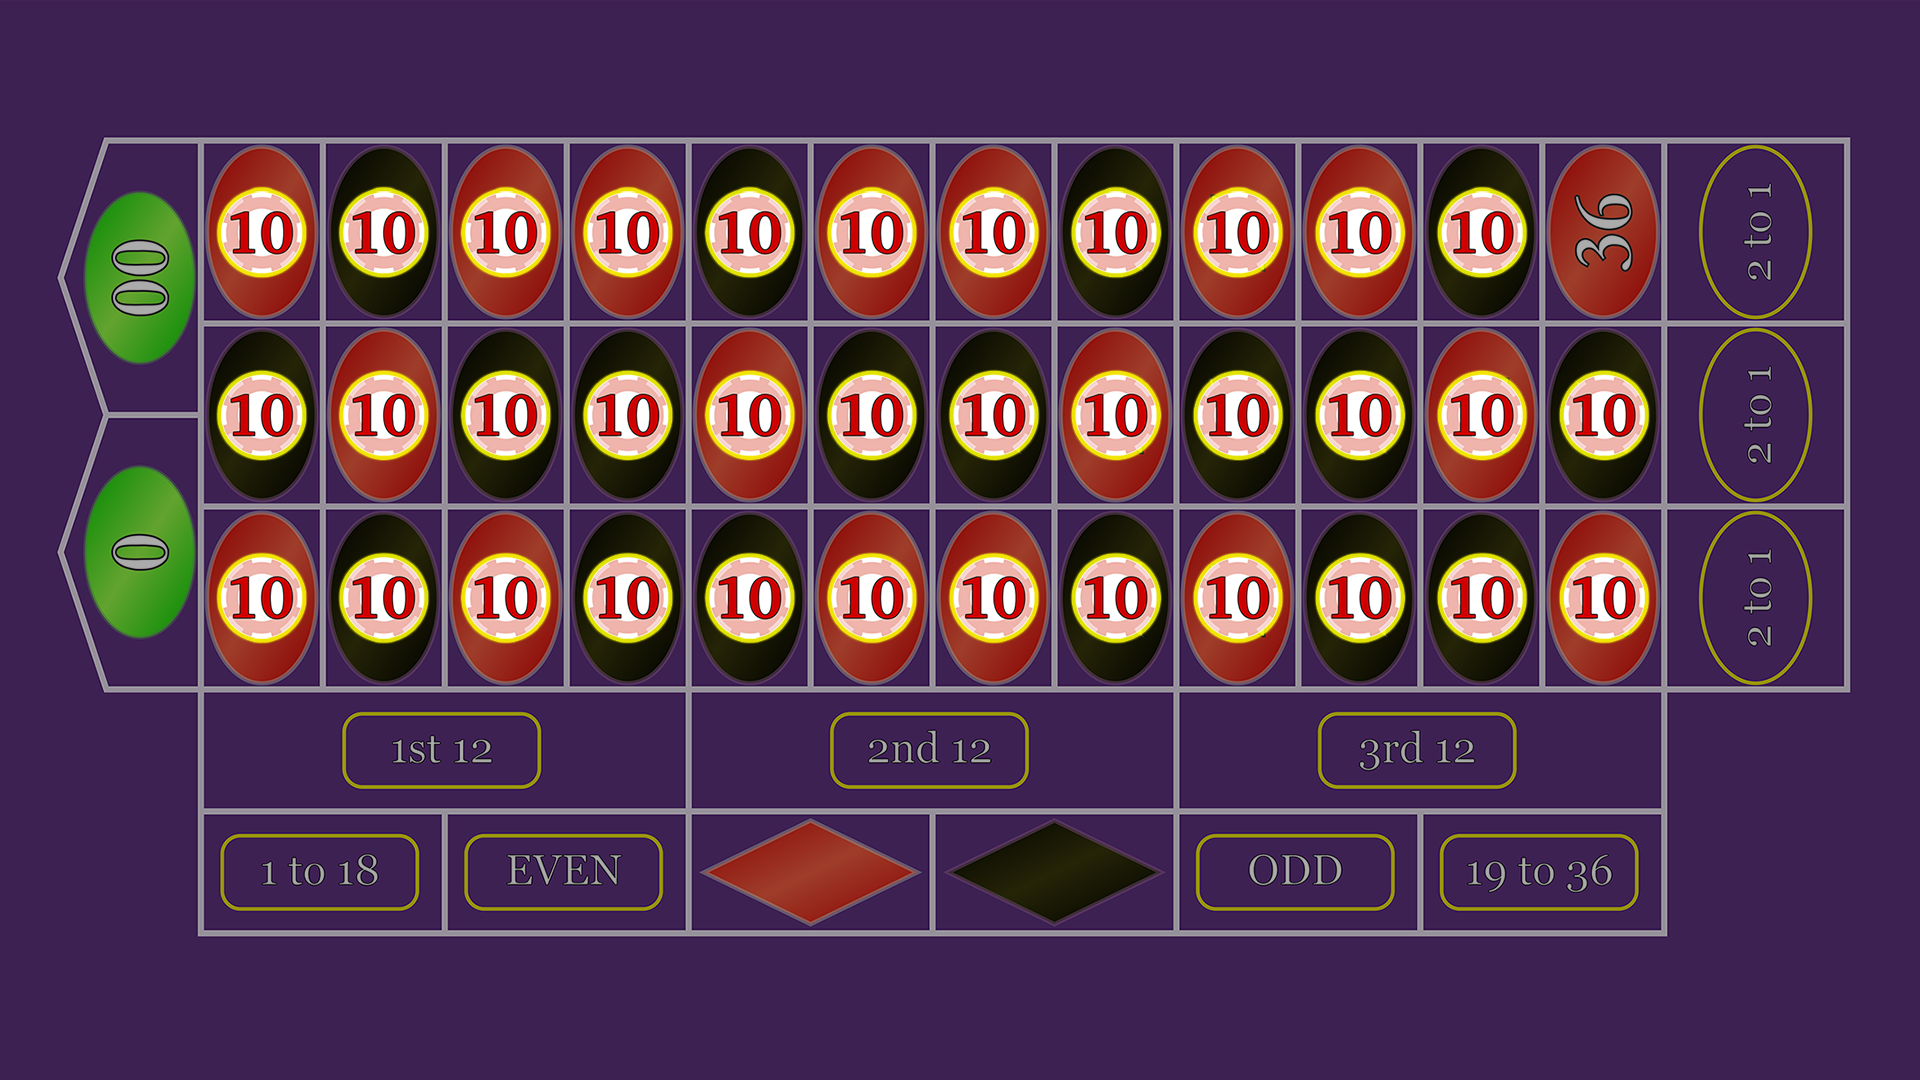
Betting Pattern 2: $10 on 35 Straight-up Bets
On the other side of the spectrum, here's a different betting pattern, where we bet $10 on the
numbers
 through
  .
.
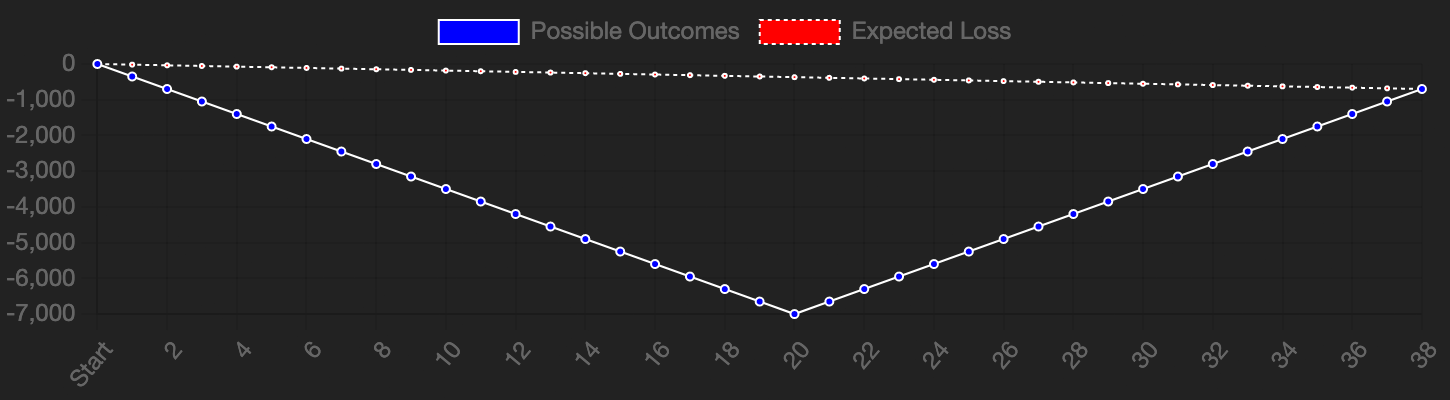
And here's the Outcome Graph for this system:
Here, you can see 3 sharp -$350 drops followed by 35 small upward +$10 bumps.
So, here you can see how these very different systems generate very different graphs.
The first system looks like a reverse checkmark, where there's a steep climb on the right. This corresponds to a system with lots of (relatively small) losses and one giant jackpot at the end.
The second system looks like a checkmark, with a sharp drop on the left. This corresponds to a few whacks, with many, many small wins that inch you back to the expected loss.
Betting Pattern 3: $350 on an Even Money Bet
Finally, let's look at a single $350 Even Money bet on
 .
.
And here's the Outcome Graph for this bet:
So this is a betting pattern that is in the middle of the two extremes. Here we losses -$350 20 times, and win +$350 18 times.
This pattern is more balanced than the first 2 systems and the graph reflects this.
What else can we do with this Graph?
And besides just predicting how the system will perform, there are a number of other statistical facets of the betting pattern that the graph will help detail.
For a full length overview of this feature and how to use it, check out this video!
